
For medium term trading (buy & sell every few months), a stock trader may feel the importance of relative monthly stock performance. If one could apply statistics to understand the months with relative stronger or weaker performance, the knowhow could help in advanced trading plan. Here is a compilation of season effect (monthly stock performance, green is a gain, red is a loss) over the past 12 years on global stock markets in Singapore, US, Hong Kong and China.
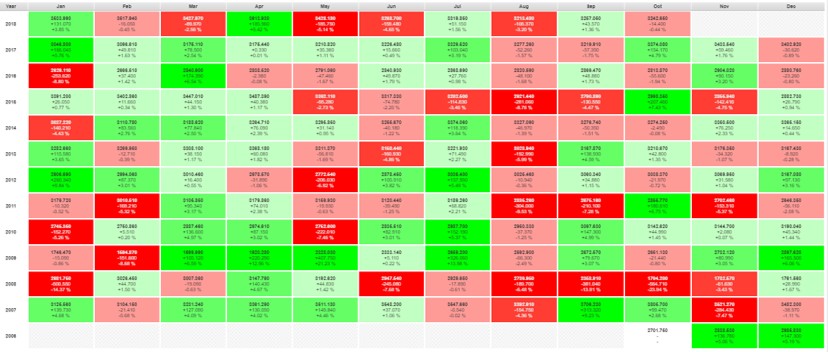
1) Singapore (Straits Times Index – STI)
Worst Month: Aug (Losses in 12 out of 12 years)
Best Months: Mar/Apr (Gains in 10 out of 12 years)
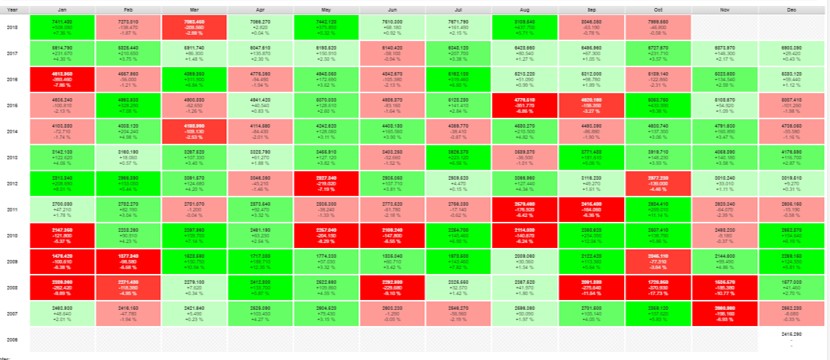
2) US (Nasdaq Composite Index – Nasdaq)
Worst Month: Jun (Losses in 8 out of 12 years)
Best Months: Apr/May/July (Gains in 9 out of 12 years)
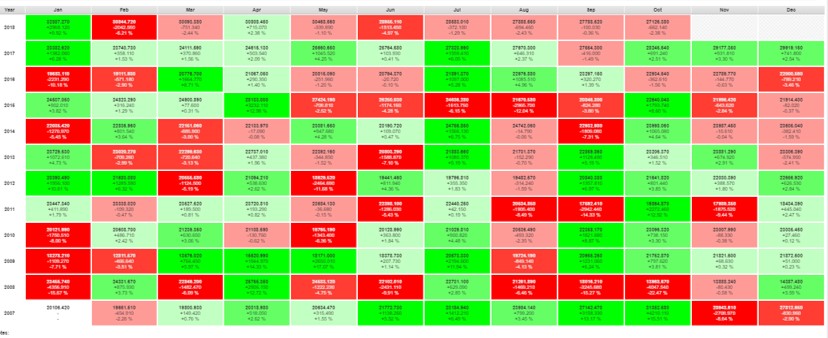
3) Hong Kong (Hang Seng Index – HSI)
Worst Months: Aug (Losses in 9 out of 12 years), May (Losses in 8 out of 12 years)
Best Month: Apr/July (Gains in 10 out of 12 years)
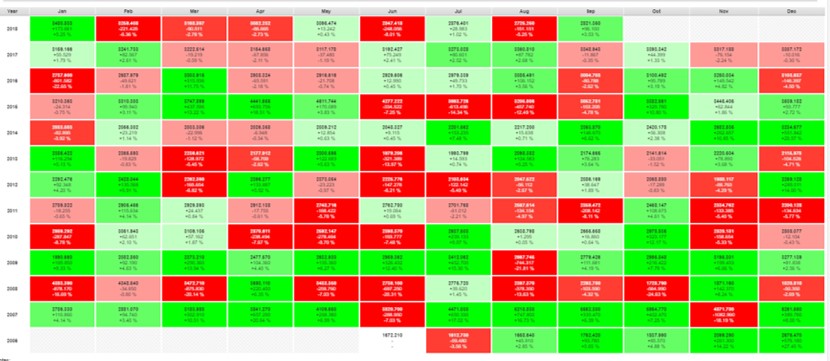
4) China (Shanghai Composite Index – SSEC)
Worst Months: Apr/Jun (Losses in 7 out of 12 years)
Best Month: Oct (Gains in 9 out of 12 years)
——————————————–
After comparison, we may conclude the following based on 12 years of monthly stock performance in these 4 global stock markets:
1) Common worst month is Aug for Singapore and Hong Kong; Jun for US and China. The season effect for worst month is regional, not global.
“Sell in May and Go Away” is only observed in Hong Kong with relatively poorer performance in May, not a strong factor for other stock markets. In fact, US has strong record of stock performance in May. So, believe in statistics, not in this myth, unless trading in Hong Kong.
2) Common best month is Apr for Singapore, US and Hong Kong; Oct for China. China is not as aligned as other global stock markets as it has its own unique regional market cycle.
Although May is not the worst performing month but due to relatively stronger performance in Apr, traders could feel the relative change with “poorer” performance in May, therefore believing in selling in May to protect the gains in Apr.
3) Singapore is much more seasonal than other global stock market, very clear in worst (12/12 years in Aug) and best (10/12 years in Mar/Apr) month performance.
STI with 30 component stocks are highly dependent on 3 major local banks (30% of STI), Telco (only left Singtel after Starhub is replaced by Dairy Farm recently), Jardine Group (15% of STI) and property (20% of STI) stocks. Many of them are dividend stocks, announcing final dividends in Q1 (XD in Q2) which could attract potential seasonal buyers, may contribute to better performance in Mar/Apr for Singapore.
Medium term swing trading (buy & sell within a few months) could give better results in general for Singapore stocks with season effect.
4) US is not as seasonal, general trend is upward, more suitable for medium term position trading with buy & hold till the uptrend has ended.
5) Season effect is not strong in China, performance has been quite evenly distributed among the months.
——————————————————
By right, there is no logic to the season effect on stock market but when there are many believers, it could become a trend. A short term trader should focus more on the unique price pattern in each individual stock of each regional stock market. A long term investor may ignore the monthly season effect, focusing on the growth with capital gains in years.
Learn from Dr Tee through 4hr high quality stock investment course (free for readers) on 10 practical trading and investing strategies with global stock market outlook. Register Here.
")